Integrated report 2020


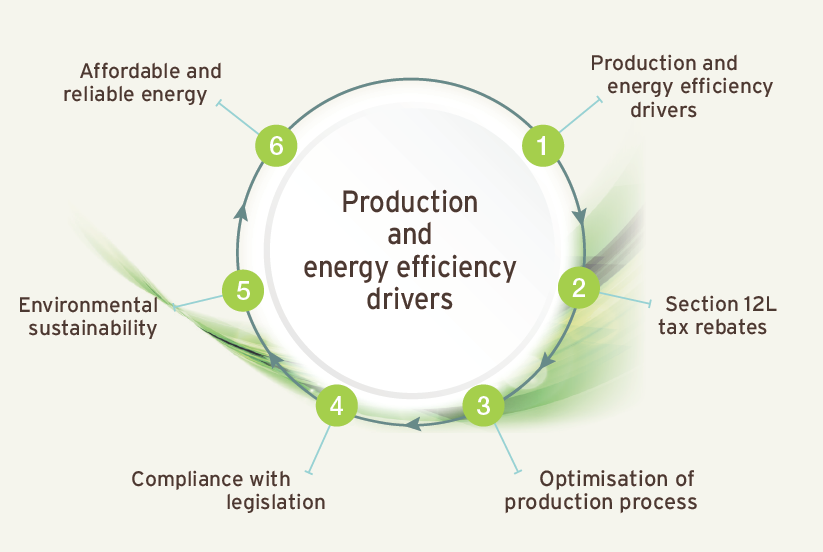
Our BUs' primary sources of energy in 2020 were electricity (63%) and diesel (25%). In 2019, the primary sources of energy were also diesel and electricity (25% and 62% respectively). Total energy consumed decreased by 0.3% in 2020 to 5 162 650 gigajoules (GJ), compared to 5 179 561GJ in 2019, attributable mainly to energy efficiency projects implemented in our BUs.
Our energy and carbon management programme aims to reduce energy consumption and increase efficient diesel and electricity consumption. Our technology and engineering department's projects aim to reduce diesel consumption at all our operations use fuel additives and payload management. Planned projects include developing a consolidated dashboard for fuel and electricity at various BUs. The dashboard will provide routine energy usage and source apportionment information. These initiatives support the transition to a low-carbon economy and enable our operations to improve energy efficiency by striving to achieve low-carbon footprints and optimise energy consumption.
We set energy intensity targets every year, based on each operation's performance over the previous years, and monitor these targets monthly. A review of targets at the end of 2017 proposed long-term (five-year) targets to facilitate our energy-saving initiatives. We implemented these targets in the second half of 2019.
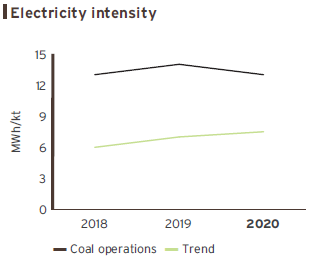
Electricity and diesel intensities decreased in 2020, mainly due to energy efficiency projects in our operations, particularly at our largest operation Grootegeluk. Based on an increase of 5% in production tonnages in 2020, electricity intensity decreased by 7% to 13MWh/kt and diesel intensity decreased by 6% to 2 042 litres (L)/kt.
| Electricity consumption in coal operations |
Electricity (MWh) | Production (kt) | Electricity intensity (MWh/kt) |
||||||
| 2020 | 2019 | 2018 | 2020 | 2019 | 2018 | 2020 | 2019 | 2018 | |
| Total | 605 770 | 624 240 | 553 100 | 47 008 | 44 813 | 41 671 | 13 | 14 | 13 |
| Change (%) | 3 | 11 | 3 | 5 | 7.0 | 6 | 7 | 7 | 7 |
| Mpumalanga | |||||||||
|---|---|---|---|---|---|---|---|---|---|
| Belfast | 2 904 | 30 | 2 850 | 1 029 | 1 | ||||
| Dorstfontein East | 17 286 | 18 254 | 909 | 1 345 | 19 | 14 | |||
| Dorstfontein West | 14 393 | 18 013 | 1 104 | 816 | 13 | 22 | |||
| Forzando North | 43 795 | 47 511 | 84 | 403 | 26 | 23 | |||
| Forzando South1 | 1 594 | 1 671 | 4 | ||||||
| Leeuwpan | 25 927 | 26 435 | 26 225 | 3 720 | 4 396 | 4 220 | 7 | 6 | 6 |
| Mafube | 26 237 | 22 970 | 15 924 | 1 818 | 1 808 | 1 145 | 14 | 13 | 14 |
| Matla | 100 358 | 103 037 | 105 757 | 6 153 | 5 991 | 6 609 | 16 | 17 | 16 |
| Arnot2 | 1 366 | 13 901 | 22 041 | ||||||
| Limpopo | |||||||||
| Grootegeluk | 371 785 | 372 149 | 381 480 | 28 776 | 27 757 | 29 698 | 13 | 13 | 13 |
| Tshikondeni | 1 651 | 1 849 | 1 550 | ||||||
| KwaZulu-Natal | |||||||||
| Durnacol | 50 | 77 | 107 | ||||||
| Hlobane | 18 | 14 | 16 | ||||||
| 1 | Electricity consumption at Forzando South is included in the Forzando North figure (consumption is for Forzando North and Forzando South hence the calculated electricity intensity reflected for Forzando North is based on production figures for both operations). |
| 2 | Arnot was transferred to Arnot Opco Proprietary Limited during Q1 2020. |
The decrease in electricity intensity (by 7%) in 2020 compared to 2019 is attributed to energy efficiency projects implemented at our operations.
Employee energy-saving behaviour has also contributed towards reductions in energy consumption. Energy efficiency programmes will be continuously implemented in our operations to ensure further reductions in energy consumption.
| Diesel consumption in coal operations |
Diesel (kL) | Production (kt) | Diesel consumption intensity (L/kt) |
||||||
| 2020 | 2019 | 2018 | 2020 | 2019 | 2018 | 2020 | 2019 | 2018 | |
| Total | 96 131 | 98 702 | 73 804 | 47 008 | 44 813 | 41 671 | 2 042 | 2 203.00 | 1 771 |
| Change (%) | 3 | 25 | 1 | 5 | 7 | 6 | 6 | 20 | 6 |
| Mpumalanga | |||||||||
|---|---|---|---|---|---|---|---|---|---|
| Belfast | 13 100 | 5 020 | 2 850 | 1 029 | 4 596 | 4 879 | |||
| Dorstfontein East | 7 154 | 9 598 | 909 | 1 345 | 7 874 | 7 136 | |||
| Dorstfontein West | 409 | 463.9 | 1 104 | 816 | 371 | 569 | |||
| Forzando North | 763 | 813.9 | 84 | 402.8 | 9 059 | 2 020 | |||
| Forzando South | 240 | 218.7 | 1 594 | 1 671 | 151 | 130 | |||
| Leeuwpan | 19 480 | 21 924 | 19 847 | 3 720 | 4 396 | 4 220 | 5 326 | 4 987 | 4 618 |
| Mafube | 4 571 | 6 768 | 5 556 | 1 818 | 1 808 | 1 145 | 2 514 | 3 744 | 4 853 |
| Matla | 2 073 | 2 194 | 2 503 | 6 153 | 5 991 | 6 609 | 337 | 366 | 379 |
| Arnot | 56 | 902 | 989 | ||||||
| Limpopo | |||||||||
| Reductants | 56 | ||||||||
| Grootegeluk | 48 189 | 50 720 | 44 520 | 28 776 | 27 757 | 29 697 | 1 675 | 1 827 | 1 412 |
| Tshikondeni | 10 | 13.7 | 16 | ||||||
| KwaZulu-Natal | |||||||||
| Durnacol | 39 | 13 | 34 | ||||||
| Hlobane | 47 | 52 | 42 | ||||||
Diesel consumption at FerroAlloys in 2020 was 12kL and 0.05kL at our corporate centre, the coneXXion.


